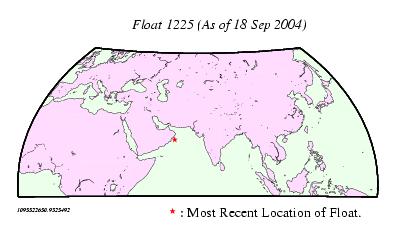
For large scale context, here is the trajectory for float 1225 using a Hammer projection...
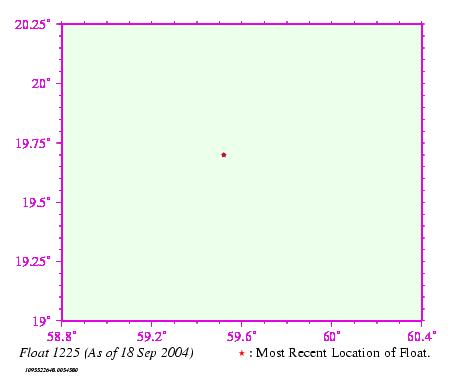
...and here is a close-up using a Mercator projection.
0339 0340 0341 0342 0343 0350 0351 0352 0353 0354 0355 0356 0357 0358 0359 0360 0627 0628 0629 0630 0672 0673 0674 0675 0676 0677 0678 0680 0681 0682 0683 0684 0685 0702 0703 0704 0706 0720 0884 0954 0955 0956 1069 1070 1071 1072 1073 1131 1132 1133 1134 1135 1136 1137 1138 1213 1214 1220 1221 1222 1223 1224 1225 1269 1283 1284 1293 1319 1501 1502 1503 1504 1505 1628 1629 1771 1772 1773 1774 1775 1796 1797 1798 1799 1800 1801 1803 2096 2097 2098 2099 2100 2101 2102 2103 2104 2105 2281 2882 2883 2884 2885 2886 2903 2904 2905 2906 2907 2908 2909
Profile summary for float 1225
These plots were rendered using the GMT graphics utilities created by Paul Wessel & Walter Smith.